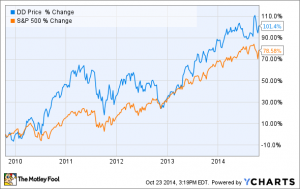
Share prices 2010-2015
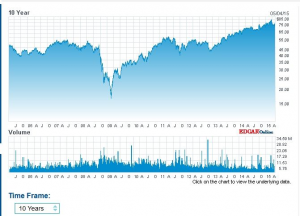
Share prices 2005-2015
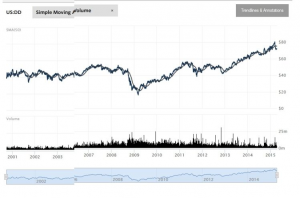
Share prices 2001-2015
DuPont (DD) has 3 splits in our DuPont stock split history database. The first split for DD took place on June 29, 1979. This was a 3 for 1 split, meaning for each share of DD owned pre-split, the shareholder now owned 3 shares. For example, a 1000 share position pre-split, became a 3000 share position following the split. DD’s second split took place on January 22, 1990. This was a 3 for 1 split, meaning for each share of DD owned pre-split, the shareholder now owned 3 shares. For example, a 3000 share position pre-split, became a 9000 share position following the split. DD’s third split took place on June 13, 1997. This was a 2 for 1 split, meaning for each share of DD owned pre-split, the shareholder now owned 2 shares. For example, a 9000 share position pre-split, became a 18000 share position following the split.
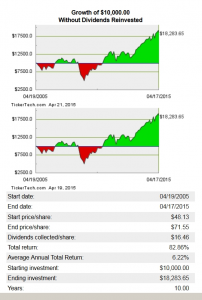
When a company such as DuPont splits its shares, the market capitalization before and after the split takes place remains stable, meaning the shareholder now owns more shares but each are valued at a lower price per share. Often, however, a lower priced stock on a per-share basis can attract a wider range of buyers. If that increased demand causes the share price to appreciate, then the total market capitalization rises post-split. This does not always happen, however, often depending on the underlying fundamentals of the business. Looking at the DuPont stock split history from start to finish, an original position size of 1000 shares would have turned into 18000 today. Below, we examine the compound annual growth rate — CAGR for short — of an investment into DuPont shares, starting with a $10,000 purchase of DD, presented on a split-history-adjusted basis factoring in the complete DuPont stock split history.
In October 2013 DuPont announced splitting out its pigments industry (Mainly TiO2) and its fluorine industries (including Teflon) with sales around $7billion to a new company called The Chemours Company. Its shares will be allotted to the holders of DuPont Shares.
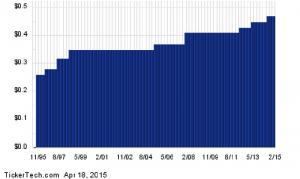
DuPont’s quarterly dividends 1995-2015
| Dec 31, 2014 | Dec 31, 2013 | Dec 31, 2012 | Dec 31, 2011 | Dec 31, 2010 | |
|---|---|---|---|---|---|
| No. shares of common stock outstanding1 | 905,414,000 | 927,717,000 | 934,288,000 | 932,253,000 | 921,634,000 |
| Selected Financial Data (USD $) | |||||
| Net income available to common stockholders (in millions) | 3,615 | 4,838 | 2,778 | 3,464 | 3,021 |
| Earnings per share (EPS)3 | 3.99 | 5.21 | 2.97 | 3.72 | 3.28 |
| Share price1, 2 | 76.00 | 61.90 | 47.29 | 52.06 | 53.71 |
| Ratio | |||||
| P/E ratio4 | 19.03 | 11.87 | 15.90 | 14.01 | 16.39 |
| Benchmarks | |||||
| P/E Ratio, Competitors | |||||
| Dow Chemical Co. | 16.68 | 12.77 | 46.00 | 16.61 | 22.85 |
| LyondellBasell Industries N.V. | 10.28 | 12.16 | 12.22 | 11.54 | – |
| Praxair Inc. | 21.92 | 21.31 | 19.64 | 19.45 | 24.62 |
| P/E Ratio, Sector | |||||
| Commodity Chemicals | 15.96 | 13.33 | 18.50 | 15.05 | 20.03 |
| P/E Ratio, Industry | |||||
| Basic Materials | 19.69 | 13.29 | 16.23 | 13.11 | 16.60 |
1 Data adjusted for splits and stock dividends.
2 Close price on the filing date of E. I. du Pont de Nemours & Co.’s Annual Report.
2014 Calculations
| Dec 31, 2014 | Dec 31, 2013 | Dec 31, 2012 | Dec 31, 2011 | Dec 31, 2010 | |
|---|---|---|---|---|---|
| No. shares of common stock outstanding1 | 905,414,000 | 927,717,000 | 934,288,000 | 932,253,000 | 921,634,000 |
| Selected Financial Data (USD $) | |||||
| Total DuPont stockholders’ equity (in millions) | 13,320 | 16,229 | 10,088 | 8,593 | 9,278 |
| Book value per share (BVPS)3 | 14.71 | 17.49 | 10.80 | 9.22 | 10.07 |
| Share price1, 2 | 76.00 | 61.90 | 47.29 | 52.06 | 53.71 |
| Ratio | |||||
| P/BV ratio4 | 5.17 | 3.54 | 4.38 | 5.65 | 5.34 |
| Benchmarks | |||||
| P/BV Ratio, Competitors | |||||
| Dow Chemical Co. | 2.55 | 2.11 | 1.86 | 1.79 | 2.06 |
| LyondellBasell Industries N.V. | 5.16 | 3.76 | 3.13 | 2.34 | – |
| Praxair Inc. | 6.60 | 5.66 | 5.48 | 5.93 | 5.08 |
| P/BV Ratio, Sector | |||||
| Commodity Chemicals | 4.15 | 3.19 | 3.13 | 3.10 | 3.36 |
| P/BV Ratio, Industry | |||||
| Basic Materials | 3.36 | 2.81 | 2.77 | 2.98 | 3.51 |
1 Data adjusted for splits and stock dividends.
2 Close price on the filing date of E. I. du Pont de Nemours & Co.’s Annual Report.
2014 Calculations
Conoco holdings: 1981 to 1998
In 1981, DuPont acquired Conoco Inc. from Seagram Company Ltd., by an exchange of shares which made Seagram DuPont’s largest single shareholder with four seats on the board of directors. On April 6, 1995, DuPont announced a deal whereby the company would buy back all the shares owned by Seagram.
DuPont, in 1998, sold 30 percent of Conoco, in the stockmarket and raised $4.4 billion from that sale, one of the largest initial public offerings in the world
DuPont announced on July 9, 1999 the terms it will provide to its shareholders for the sale of the 70 percent stake it holds in Conoco Inc. DuPont is calling the transaction a “split-off,” because stockholders will have a choice whether to swap their shares or not. The ratio will be one common share of DuPont stock in exchange for 2.95 shares of Conoco Class “B” stock currently held by DuPont, to a maximum of 148 million shares. That’s a premium of about 18 percent. The exchange is to be based on Thursday’s closing prices of both companies. DuPont ended the day Thursday at 68-5/8, while Conoco closed Thursday at 27-3/8. DuPont announced the conclusion of its exchange offer of Conoco stock for DuPont stock, marking the completion of divestment of DuPont’s entire investment in Conoco. In accordance with the exchange offer announced earlier this year, DuPont said it has accepted for exchange 147.9m shares of DuPont common stock for 436.5m shares of Conoco Class B common stock on the basis of 2.95 shares of Conoco Class B stock for each share of DuPont common stock.
The owners of the Conoco and the Phillips shares approved the $15.6 billion merger of both companies, on March 12, 2002. With the present Conoco merger, Phillips shareholders will own 56.6 percent of the combined company while Conoco shareholders will get 43.4 percent.

