Reading company reports
You do not have to be an economist in order to extract the important items from a company reports.
The examples below were taken from the 2006 DuPont report.
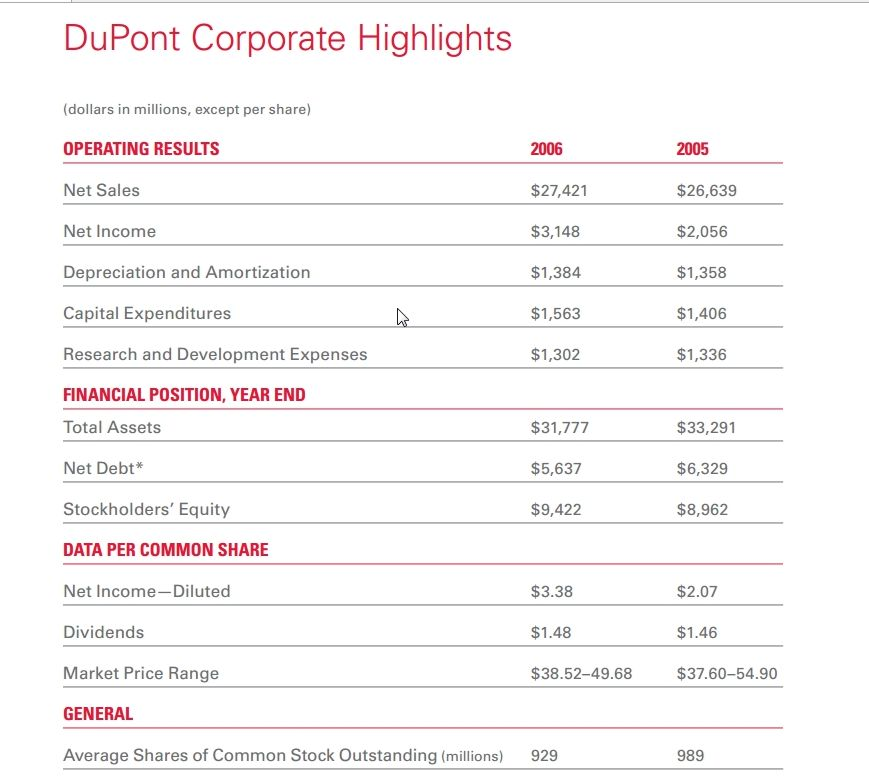
Net sales – the company income for the year- $27.421 billion
Net income – The profits for the year- $3.148 billion
Total assets – The books value of the company – $31.777 billion
Net debt – the debts of the company (Mainly to banks) – $5.637 billion
Stockholders equity- The stock owners share of the company = Total assets – debt- Other commitments $9.422 billion-
Financial analysis includes dividing most items by many other items to get ratios.
The most important ratios are:
Profits on sales. In this case: 3148/27421*100=11.48% – A fairly good value for the chemical industry
Debt to equity ratio-5637/9422*100= 59% – Borderline. The desired value is below 50%.
All manipulations using stock values are meaningless, because they change from day to day, often not due to anything the company did.
Other interesting values are the use of company funds for plant construction and for research.
See the page below:
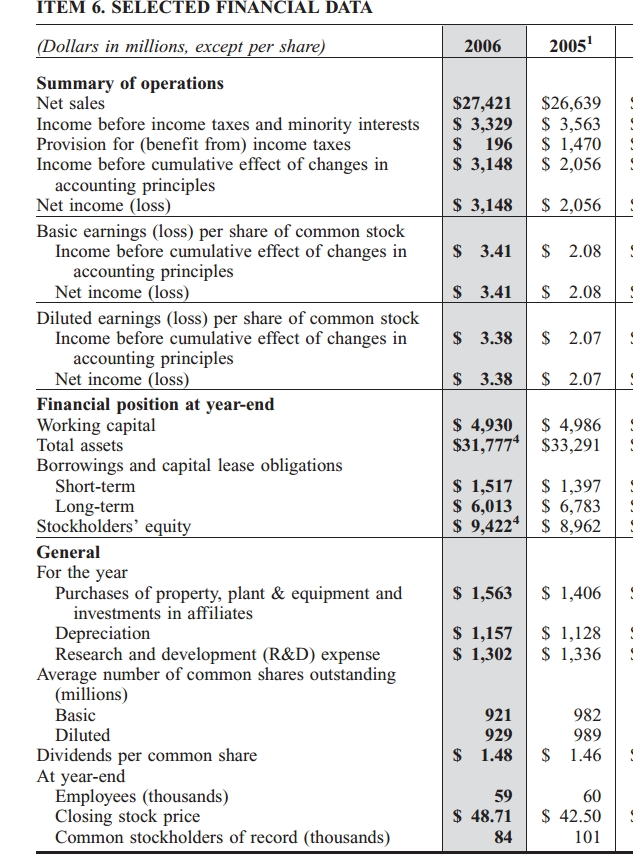
Note the item Depreciation – More than $1 billion. This is the amount calculated by income tax rules for the depreciated value of the equipment. It is supposed to be used to buy new equipment. However, it also means extra cash in the bank and is often misused. (But not in above example, where it was used for new equipment)
| VALUATION MEASURES | |
|---|---|
| Market Cap (intraday): | 47.11B |
| Enterprise Value (21-Apr-05)³: | 50.29B |
| Trailing P/E (ttm, intraday): | 26.76 |
| Forward P/E (fye 31-Dec-06)¹: | 14.86 |
| PEG Ratio (5 yr expected)±: | 1.73 |
| Price/Sales (ttm): | 1.71 |
| Price/Book (mrq): | 4.30 |
| Enterprise Value/Revenue (ttm)³: | 1.80 |
| Enterprise Value/EBITDA (ttm)³: | 24.81 |
| FINANCIAL HIGHLIGHTS | |
| Fiscal Year | |
| Fiscal Year Ends: | 31-Dec |
| Most Recent Quarter (mrq): | 31-Dec-04 |
| Profitability | |
| Profit Margin (ttm): | 6.33% |
| Operating Margin (ttm): | 5.15% |
| Management Effectiveness | |
| Return on Assets (ttm): | 4.81% |
| Return on Equity (ttm): | 17.39% |
| Income Statement | |
| Revenue (ttm): | 28.00B |
| Revenue Per Share (ttm): | 27.929 |
| Revenue Growth (lfy)³: | 1.00% |
| Gross Profit (ttm)²: | 7.58B |
| EBITDA (ttm): | 2.03B |
| Net Income Avl to Common (ttm): | 1.77B |
| Diluted EPS (ttm): | 1.77 |
| Earnings Growth (lfy)³: | 82.90% |
| Balance Sheet | |
| Total Cash (mrq): | 3.54B |
| Total Cash Per Share (mrq): | 3.55 |
| Total Debt (mrq)²: | 6.48B |
| Total Debt/Equity (mrq): | 0.57 |
| Current Ratio (mrq): | 1.916 |
| Book Value Per Share (mrq): | 11.203 |
| Cash Flow Statement | |
| From Operations (ttm)³: | 3.23B |
| Free Cashflow (ttm)³: | 2.00B |